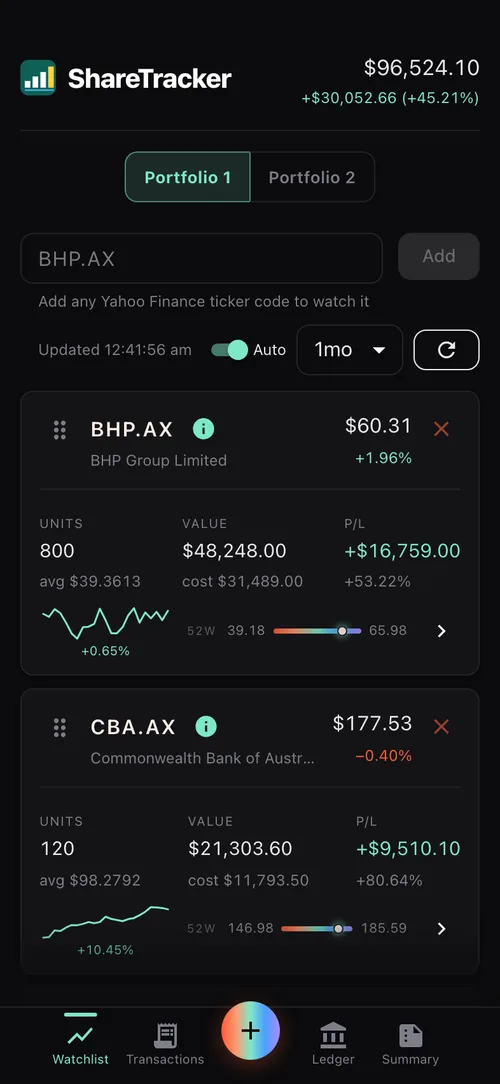
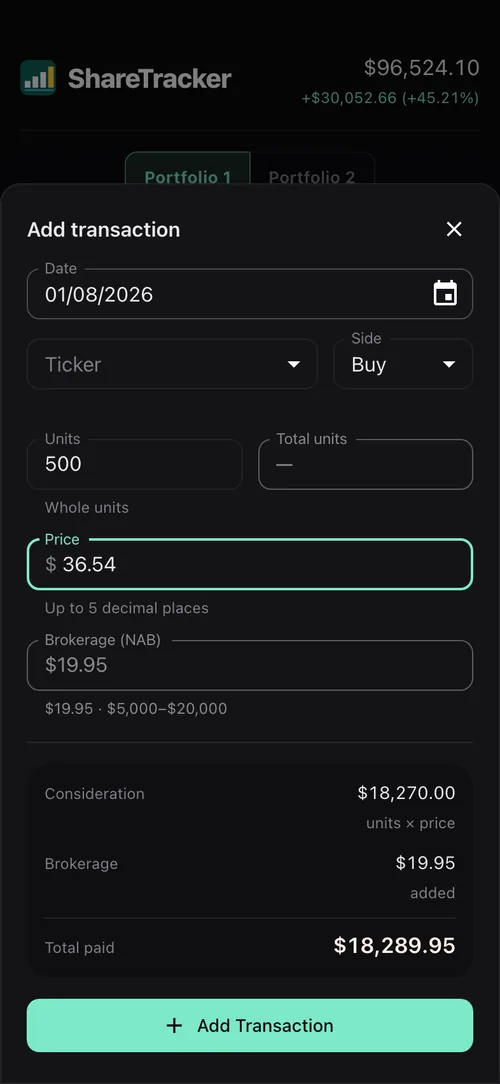
Share Tracker turns a plain list of buys and sells into a live picture of your ASX portfolio. Log a trade — it works the brokerage out from the trade value — and everything else follows: units held, average cost, and what you're up or down against live prices. Nothing is stored twice. Every number on the board is derived from the trade log, so it can't quietly drift away from what you actually own.
Live ASX prices & sparklines
Brokerage worked out for you
Dollar-cost average per holding
Realised & unrealised P/L
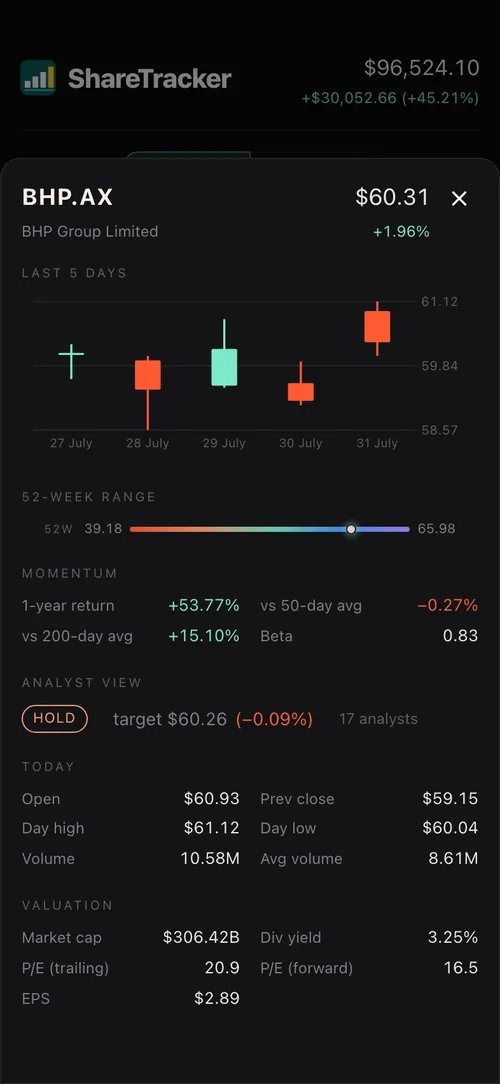
Candlesticks & 52-week range
Phone and desktop layouts
The whole portfolio at a glance
Log a trade, brokerage and all
The numbers behind a holding
Private beta
Share Tracker uses the moving-average cost method, the usual portfolio-tracker convention. It isn't parcel-based CGT accounting, and it isn't financial advice.